이 문서는 Ubuntu-20.04 LTS 버전 기준으로 작성되었다.
- git clone을 이용하든 https://github.com/lava/matplotlib-cpp에 직접 접속하든 선택하여 matplotlibcpp.h파일을 /usr/include 혹은 /usr/local/include 에 넣는다.
- sudo apt install python-numpy를 터미널에서 실행한다.
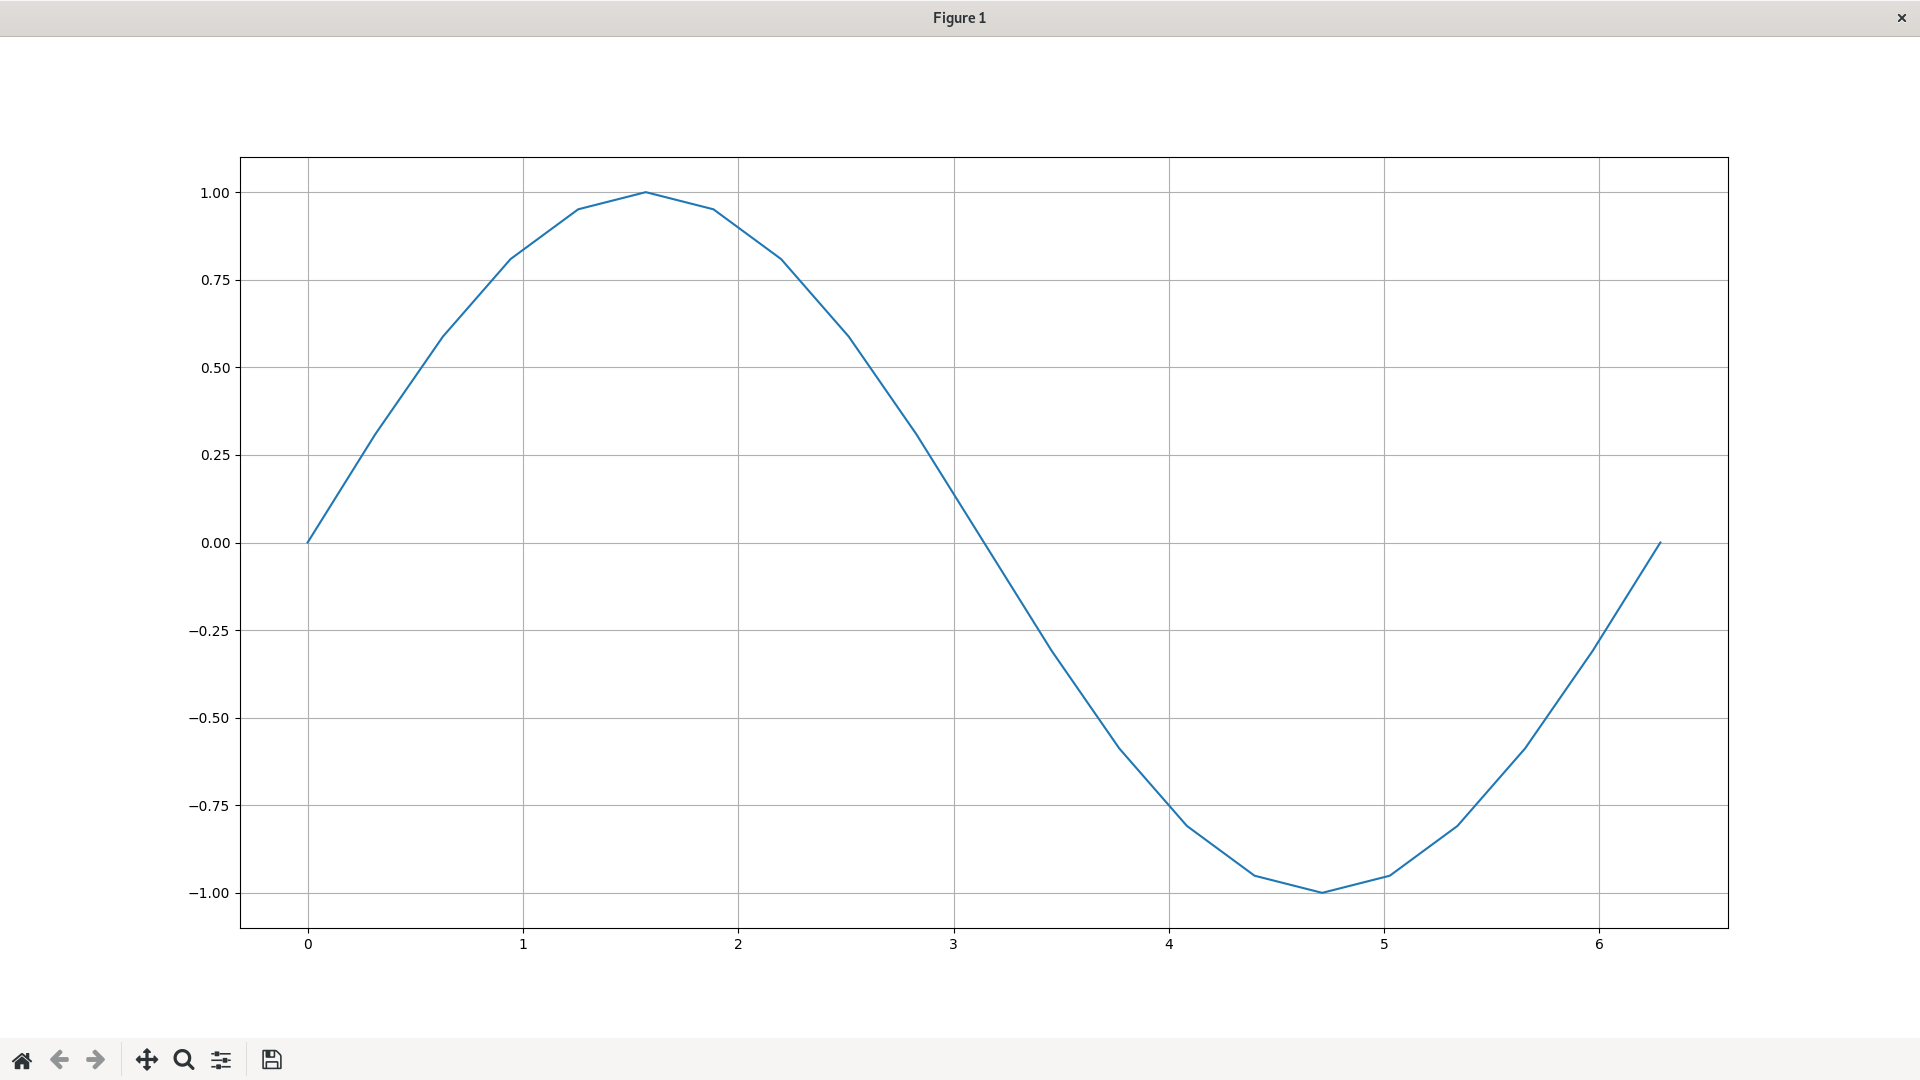
다음은 간단히 sin 그래프를 그리는 예제코드다. <Code:C++ | example.cpp>
#include <iostream> #include <vector> #include <cmath> #include <matplotlibcpp.h>
using std::vector; using std::sin; using std::cout;
namespace plt = matplotlibcpp;
int main() {
  const double pi = M_PI;

  vector<double> x(21);
  vector<double> y(21);
  for(int i = 1; i < x.capacity(); ++i)
  {
      x[i] = x[i-1] + pi/10;
      y[i] = sin(x[i]);
  }
  plt::plot(x,y); //plot the x,y
  plt::grid(true); //show grid
  plt::show(); // show figure
} </Code>
컴파일할 때는 <Code:Shell> g++ example.cpp -I/usr/include/python3.8 -lpython3.8 -o example </Code>
로 하면 된다.
